In this analysis, we dissect the gold market (XAU/USD) using a confluence of three powerful methodologies: Smart Money Concepts (SMC), Volume Spread Analysis (VSA), and Price Action. This multi-layered approach helps us uncover institutional intent, understand the volume dynamics, and confirm market structure behavior to develop a high-probability trade setup.
Smart Money Concepts (SMC)
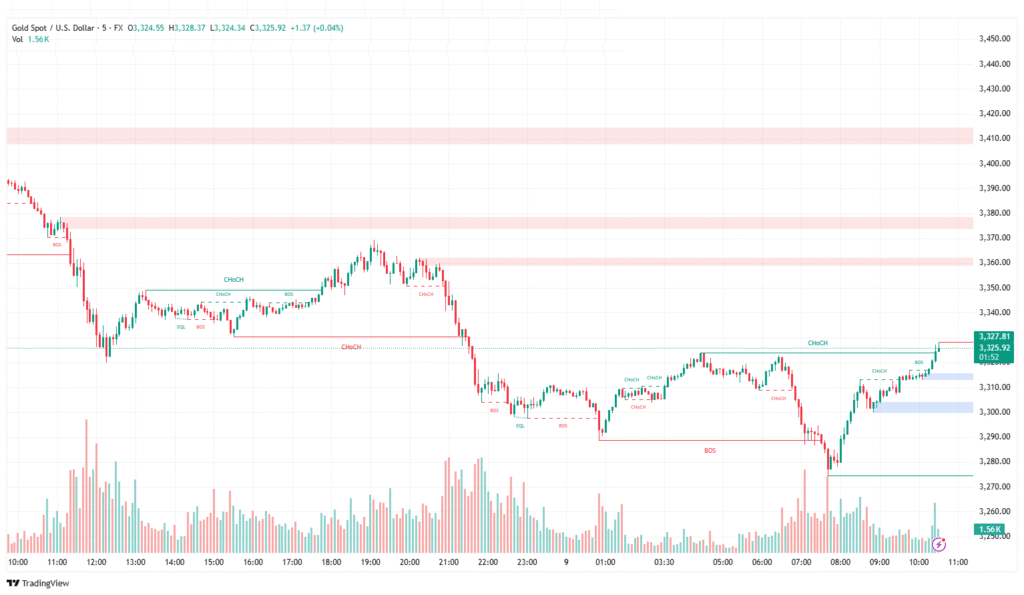
1. Change of Character (ChoCH) & Break of Structure (BOS)
The chart showcases multiple structural shifts. Initially, we observe a strong downtrend, confirmed by consecutive Breaks of Structure (BOS). However, the market begins to signal a Change of Character (ChoCH) around the 3,310 level, indicating a potential reversal and transition into bullish conditions.
2. Liquidity Sweep and Demand Zones
A notable liquidity sweep occurs below 3,270, clearing out sell-side liquidity and triggering a reversal. This is a classic SMC behavior where smart money hunts stop-losses before reversing direction.
The price then rebounds strongly from a well-respected demand zone (marked in blue), with subsequent BOS confirming that bullish order flow has taken over.
Volume Spread Analysis (VSA)
VSA gives us insight into the relationship between price movement and volume, helping to identify professional activity.
1. Stopping Volume and Absorption
At the lows around 3,270, we observe wide down bars accompanied by high volume. This typically indicates Stopping Volume—where selling pressure is being absorbed by larger interests preparing for a reversal.
2. Effort vs. Result
As the price rises post-ChoCH, we see increasing bullish volume, which confirms the effort (volume) is producing result (price movement). This suggests professional buying and validates the reversal.
Price Action Confirmation
Price Action provides a final layer of validation to the setup.
1. Bullish Engulfing and Structure Shift
The price prints a bullish engulfing candle after the liquidity sweep—a reliable reversal pattern. Subsequent higher highs (HH) and higher lows (HL) indicate the beginning of a bullish trend.
2. Breakout & Retest Setup
The breakout above the 3,310 structure (prior resistance) with strong volume confirms the momentum. A potential pullback to this level presents an ideal break-and-retest entry.
Preferred Trade Setup: Long Position (Buy)
Combining all the insights, here’s the high-probability trade setup:
| Trade Parameter | Description |
|---|---|
| Bias | Bullish |
| Entry | Pullback to 3,310 zone (retest of BOS and demand) or aggressive entry around 3,326–3,328 |
| Stop Loss | Below demand zone or last swing low (~3,295) |
| Take Profit 1 | 3,370 – minor supply zone |
| Take Profit 2 | 3,410 – major supply and previous structure |
| Risk:Reward | Approx. 1:3 or higher |
This trade is supported by SMC structural reversal, VSA volume confirmation, and classic price action behavior.
Final Thoughts
Combining Smart Money Concepts with Volume and Price Action forms a powerful trading trifecta. In this scenario, the market has signaled a clear reversal from bearish to bullish, providing a well-defined and favorable long setup with institutional confirmation.
As always, risk management remains key—stay disciplined, and let the confluence guide your trades.
⚠️ Risk Disclaimer
The content provided in this analysis is for educational and informational purposes only. It does not constitute investment advice, financial advice, or a recommendation to buy or sell any financial instrument. Trading involves risk, and you should only trade with capital you can afford to lose. Past performance is not indicative of future results. Always conduct your own research and consult with a licensed financial advisor before making any trading decisions.